
Page 35 - GCC Citizens in the UAE 2017
P. 35
32 GCC Citizens in the UAE 33 GCC Citizens in the UAE
Annual Statistical Report on Joint GCC Economic Action - 2017
Annual Statistical Report on Joint GCC Economic Action - 2017
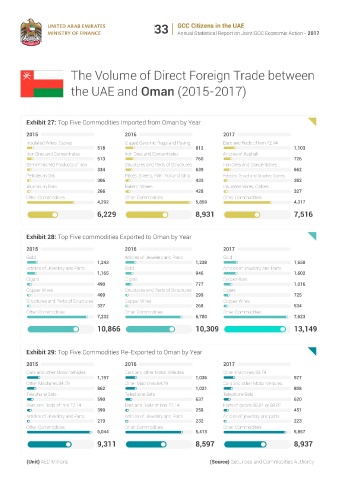
The Volume of Direct Foreign Trade between The Volume of Direct Foreign Trade between
the UAE and Saudi Arabia (2015-2017) the UAE and Oman (2015-2017)
Exhibit 24: Top Five Commodities Imported from Saudi Arabia by year Exhibit 27: Top Five Commodities Imported from Oman by Year
2015 2016 2017 2015 2016 2017
Polymers of Ethylene Gold Petroleum Oils Insulated Wires, Cables Glazed Ceramic Flags and Paving Bars and Rods of Iron 72.14
1,450 2,166 2,012 518 812 1,103
Petroleum Oils Petroleum Oils Gold Iron Ores and Concentrates Iron Ores and Concentrates Articles of Asphalt
915 2,053 1,475 513 760 726
Insulated Wire, Cables Polymers of Ethylene Polymers of Ethylene Semi-Finished Products of Iron Structures and Parts of Structures Iron Ores and Concentrates
868 1,158 1,196 334 639 662
Organic Surface-Active Agents Insulated Wire, Cables Insulated Wires, Cables Petroleum Oils Plates, Sheets, Film, Foil and Strip Pebbles, Gravel and Crushed Stones
729 1,035 827 306 433 382
Gold Organic surface-active agents Organic Surface-Active Agents Aluminum Bars Bakers' Wares Insulated Wires, Cables
510 700 827 266 428 327
Other Commodities Other Commodities Other Commodities Other Commodities Other Commodities Other Commodities
10,042 9,318 9,817 4,292 5,859 4,317
14,514 16,430 16,153 6,229 8,931 7,516
Exhibit 25: Top Five commodities Exported to Saudi Arabia by year Exhibit 28: Top Five commodities Exported to Oman by Year
2015 2016 2017 2015 2016 2017
Gold Gold Gold Gold Articles of Jewelery and Parts Gold
5,977 3,184 4,730 1,243 1,238 1,650
Articles of Jewelery and Parts Other Printed Matters Articles of Jewelery and Parts Articles of Jewelery and Parts Gold Articles of Jewelery and Parts
1,321 1,525 2,074 1,165 946 1,602
Copper wire Copper Wires Copper Wires Cigars Cigars Cooper Bars
1,201 969 666 490 777 1,016
Other Printed Matters Articles of Jewelery and Parts Other Printed Matters Copper Wires Structures and Parts of Structures Cigars
845 689 559 409 299 725
Bars and Rods of Iron 72.14 Medicaments Portland Cement Structures and Parts of Structures Copper Wires Copper Wires
539 575 384 327 268 534
Other Commodities Other Commodities Other Commodities Other Commodities Other Commodities Other Commodities
5,440 3,869 3,560 7,232 6,780 7,623
15,324 10,812 11,972 10,866 10,309 13,149
Exhibit 26: Top Five Commodities Re-Exported to Saudi Arabia by year Exhibit 29: Top Five Commodities Re-Exported to Oman by Year
2015 2016 2017 2015 2016 2017
Cars and Other Motor Vehicles Telephone Sets Telephone Sets Cars and other Motor Vehicles Cars and other Motor Vehicles Other machines 84.79
1,845 1,063 1,216 1,197 1,036 977
Telephone Sets Cars and other motor vehicles Articles of Asphalt Other Machines 84.79 Other Machines 84.79 Cars and other Motor Vehicles
779 875 638 862 1,021 808
Vehicles for the Transport of Goods T-shirts, Singlets and Other Vests Turbines Telephone Sets Telephone Sets Telephone Sets
484 362 629 590 637 620
T-shirts, Singlets and Other Vests Articles of Jewelery and Parts Vehicles for the Transport of Goods Bars and Rods of Iron 72.14 Bars and Rods of Iron 72.14 Parts of goods 88.01 or 88.02
468 248 378 399 258 451
Beauty or Make-up Preparations Parts of the Motor Vehicles Parts of Goods of 88.02 or 88.1 Articles of Jewelery and Parts Articles of Jewelery and Parts Articles of jewelery and parts
398 219 110 219 232 223
Other Commodities Other Commodities Other Commodities Other Commodities Other Commodities Other Commodities
4,910 3,912 1,830 6,044 5,413 5,857
8,884 6,679 4,801 9,311 8,597 8,937
(Unit) AED Millions (Source) Securities and Commodities Authority (Unit) AED Millions (Source) Securities and Commodities Authority