
Page 5 - A0-Posters
P. 5
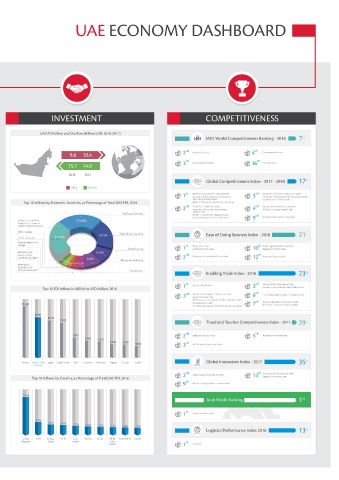
UAE ECONOMY DASHBOARD


 GDP  TRADE        INVESTMENT                                            COMPETITIVENESS


 Oil and Non-Oil Sectors Contribution to UAE Real GDP, in Percentage, 2017  Volume of Non-Oil Foreign Trade  UAE FDI Inflow and Outflow (Billion USD, 2016-2017)
 (Billion USD 2011-2017, Including Free Zones & Warehouse (2016-2017))   IMD World Competitiveness Ranking - 2018  7 th

 430  437  435  439                                              2 nd                    4 th
 410  424                9.6  10.4                                  • Business efficiency    • Government efficiency
 355                                                              rd                       th
 263  270  259  273  266                                         3  • Economic performance  36  • in Infrastructure
 250                     15.7 14.0
 226
                         2016  2017
 109  121  124  114  109  121                                            Global Competitiveness Index - 2017 - 2018  17 th
 95
 51  46  43  50  53  52   Inflow  Outflow
 Non-oil sectors  Oil sector  34
                                                                 1 st  • Efficiency of Government Spending Index  3 rd  • Availability of Scientists and Engineers Index
 2011  2012  2013  2014  2015  2016  2017                           • Government Pronouncement of Advanced   • Protection of Minority Shareholders’ Interests Index
                                                                     Technology Products Index  • Goods Market Efficiency Index.
 UAE Real GDP by Sector, in Percentage, 2017  Top 10 Inflows by Economic Activities, as Percentage of Total UAE FDI, 2016  • Effect of Taxation on Incentives to Invest Index
 Percentage of Growth Annual Foreign Trade                       2 nd  • Public Trust in Politicians Index  4 th  • Quality of Overall Infrastructure Index
                                                                    • Favoritism in Decisions of Government
                                                                                             • FDI and Technology Transfer Index
                                                                     Officials Index
 15%  5%  2%  -3%  3%  1%                   Real Estate Activities  • Burden of Government Regulation Index  th
 Mining and quarrying                                               • Country Capacity to Attract Talent Index  9  • Strength of Investor Protection Index
 (includes crude oil and natural gas)  Wholesale and Retail
 Wholesale, Retail Trade   Trade, repair of motor
 and Repairing Services  vehicles and motorcycles
 Total Foreign Trade  Imports  Non-Oil Exports  Re-Export  Other Sectors
                                           Financial and Insurance       Ease of Doing Business Index - 2018  21 st
       Communication
 Construction  Transportation and
 Top Countries by the Volume and Percentage of UAE Non-oil Foreign Trade,   storage   1 st  • Paying Taxes Index  10 th  • Protecting Minority Investors Index
 Including Free Zones, In USD billions, 2017   Electricity, Gas,   Manufacturing  • Getting Electricity Index  • Registering Property Index
 Manufacturing  Steam and Air                                     nd                        th
 Other Sectors                                                   2  • Dealing with Construction Permits Index  12
       Conditioning Supply                                                                   • Enforcing Contracts Index
 China                                     Mining and Quarrying
 Information and   Financial and insurance   12.2% (53.3)  Professional,
 communication  activities  Scientific and
       Technical Activities                   Construction
 Electricity, Gas and Water  Public administration and defence           Enabling Trade Index - 2016      23 rd
 compulsory social security
 Transportation and storage  Real Estate activities
 India                                                            st                       rd
 7.9% (34.8)    Top 10 FDI Inflows in MENA in USD Million, 2016  1  • Quality of Roads Index  3  • Quality of Port Infrastructure Index
                                                                                             • Available Airline Seat Kilometers Millions Index
 2.4% (10.4)  Vietnam                                             nd                       th
 Oil and Non-Oil Sectors Contribution to UAE current GDP, in Percentage, 2015-2017  Iraq  2  • Quality of Air Transport Infrastructure index  6  • Time Predictability of Import Procedures Index
 2.9% (12.9)                                                        • Customs Services Index   th
                                                                    • Efficiency and Accountability of Public Institutions Index
                                                                    • Physical Security Index   7  • Ease and Affordability of Shipment Index
 USA  Turkey                                                        • Availability and Quality of Transport Infrastructure Index  • ICT Use for biz-to-biz Transactions Index
 7% (30.6)  3% (13.3)
 3.1% (13.4)  Germany                                                    Travel and Tourism Competitiveness Index - 2017  29 th
 Saudi Arabia
 4.9% (21.6)                                                      nd                       th
 2015  2016  2017  3.6% (15.8)  Japan                            2  • Safety and Security Index  5  • Business Environment Index
 Iran                                                             rd
 3.9% (17.4)                                                     3  • Air Transport Infrastructure Index
 Non-oil sectors  Oil sector
 UAE Current GDP by Sector, in Percentage, 2017  UAE Non-Oil Foreign Trade Partners  Turkey  United Arab  Egypt  Saudi Arabia  Iran  Lebanon  Morocco  Algeria  Jordan  Sudan  Global Innovation Index - 2017  35 th
 (Percentage of UAE Non-oil Foreign Trade by Continents, Including Free Zones, 2017)  Emirates
 Wholesale, Retail Trade                                          nd                        th
 and Repairing Services                                          2  • State of Cluster Development Index  13  • Government’s Online Service Index
                                                                                             • Logistics Performance Index
 Asia       Top 10 Inflows, by Country, as Percentage of Total UAE FDI, 2016
 Financial and insurance activities                              9 th  • Ease of Protecting Minority Investors Index
 Mining and quarrying
 (includes crude oil and natural gas)
 Manufacturing
 South and Central America                                                                                 st
 and the Caribbean                                                       Arab World Ranking               1
 Other Sectors  Construction                                     1 st  • in all main indices above
 Austrailian and Pacific
 Public administration   Islands and others
 and defence; compulsory
 Professional, scientific and   social security  Northern America
 technical activities                                                                                       th
 Electricity, Gas and Water                                              Logistics Performance Index 2016  13
 Real Estate activities
         United   India  United   France  Saudi   Austria  Japan  British  Switzerland  Kuwait
 Transportation and storage  Kingdom  States  Arabia  Virgin      st
 Africa  Europe                        Islands                   1  • in MENA