
Page 19 - RT Arabic Case Study
P. 19
CASE STUDY 19
RT Arabic Infographics info@datatruestory.com
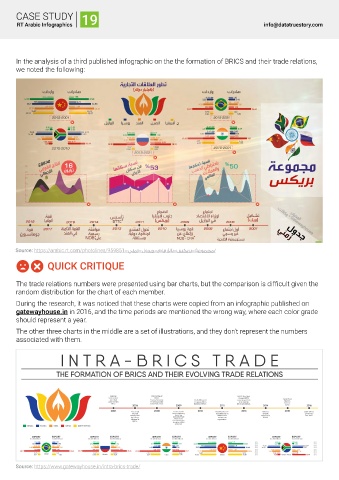
In the analysis of a third published infographic on the the formation of BRICS and their trade relations,
we noted the following:
Source: https://arabic.rt.com/photolines/959851-ينمز-لودج-ماقرلأاب-سكيرب-ةعومجم/
QUICK CRITIQUE
The trade relations numbers were presented using bar charts, but the comparison is difficult given the
random distribution for the chart of each member.
During the research, it was noticed that these charts were copied from an infographic published on
gatewayhouse.in in 2016, and the time periods are mentioned the wrong way, where each color grade
should represent a year.
The other three charts in the middle are a set of illustrations, and they don't represent the numbers
associated with them.
Source: https://www.gatewayhouse.in/intra-brics-trade/