
Page 23 - RT Arabic Case Study
P. 23
CASE STUDY 23
RT Arabic Infographics info@datatruestory.com
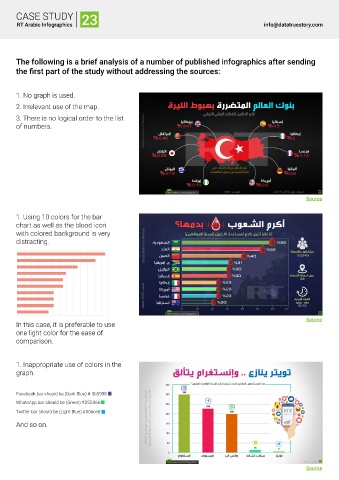
The following is a brief analysis of a number of published infographics after sending
the first part of the study without addressing the sources:
1. No graph is used.
2. Irrelevant use of the map.
3. There is no logical order to the list
of numbers.
Source
1. Using 10 colors for the bar
chart as well as the blood icon
with colored background is very
distracting.
Source
In this case, it is preferable to use
one light color for the ease of
comparison.
1. Inappropriate use of colors in the
graph.
Facebook bar should be (Dark Blue) # 3b5998
WhatsApp bar should be (Green) #25D366
Twitter bar should be (Light Blue) #00aced
And so on.
Source